Welcome to
Harwinton
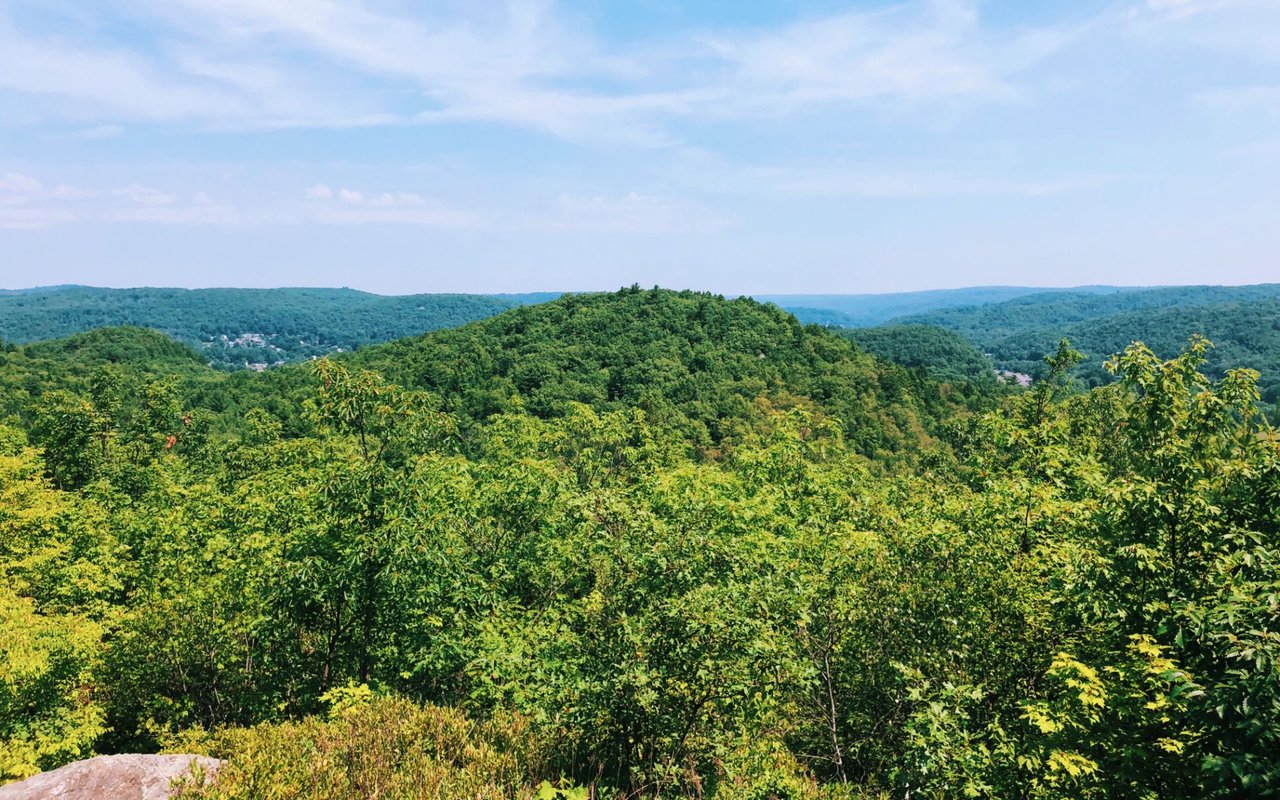
A quiet rural community known for rolling hills, privacy, and beautiful country landscapes.
5,565 people live in Harwinton, where the median age is 47.3 and the average individual income is $56,170. Data provided by the U.S. Census Bureau.
Total Population
Median Age
Population Density
Average individual Income
Tucked between Litchfield County’s rolling hills and scenic countryside, Harwinton offers peaceful rural living with easy access to nearby towns and conveniences. Known for its quiet backroads, spacious properties, and beautiful natural surroundings, Harwinton provides a true New England country atmosphere while remaining close to Torrington, Bristol, and Hartford County.
The town is made up of scenic neighborhoods, farmland, wooded landscapes, and charming residential areas that appeal to buyers seeking privacy, land, and a slower pace of life.
Residents appreciate:
Harwinton’s location allows residents to enjoy the beauty and tranquility of country living while still being conveniently connected to shopping, dining, schools, and commuter routes throughout central and northwestern Connecticut.
There's plenty to do around Harwinton, including shopping, dining, nightlife, parks, and more. Data provided by Walk Score and Yelp.
Explore popular things to do in the area, including Freedom Foods, The Nutmeg Fudge Company, and Speedy Tacos.
| Name | Category | Distance | Reviews |
Ratings by
Yelp
|
|---|---|---|---|---|
| Dining | 4.69 miles | 5 reviews | 5/5 stars | |
| Dining | 4.5 miles | 15 reviews | 4.8/5 stars | |
| Dining | 4.47 miles | 24 reviews | 4.8/5 stars | |
| Dining | 4.73 miles | 4 reviews | 5/5 stars | |
| Active | 4.54 miles | 6 reviews | 5/5 stars | |
| Beauty | 4.56 miles | 7 reviews | 5/5 stars | |
| Beauty | 4.59 miles | 4 reviews | 5/5 stars | |
|
|
||||
|
|
||||
|
|
||||
|
|
||||
|
|
||||
|
|
Harwinton has 2,166 households, with an average household size of 2.55. Data provided by the U.S. Census Bureau. Here’s what the people living in Harwinton do for work — and how long it takes them to get there. Data provided by the U.S. Census Bureau. 5,565 people call Harwinton home. The population density is 180 and the largest age group is Data provided by the U.S. Census Bureau.
Total Population
Population Density Population Density This is the number of people per square mile in a neighborhood.
Median Age
Men vs Women
Population by Age Group
0-9 Years
10-17 Years
18-24 Years
25-64 Years
65-74 Years
75+ Years
Education Level
Total Households
Average Household Size
Average individual Income
Households with Children
With Children:
Without Children:
Blue vs White Collar Workers
Blue Collar:
White Collar:
Explore Other Towns
